Simplify Technical Analysis
A streamlined approach to technical analysis, combining sentiment, conviction, and key market zones into one toolkit.
Runs on TradingView · One-time payment · Lifetime updates
- Play Video Here
Everything You Get
Six tools plus a live community, in one one-time purchase.
Here’s the whole thing at a glance, each piece is broken down below.
Main Features
- Hill ZonesBuyer & seller zones, auto-drawn on any chart.
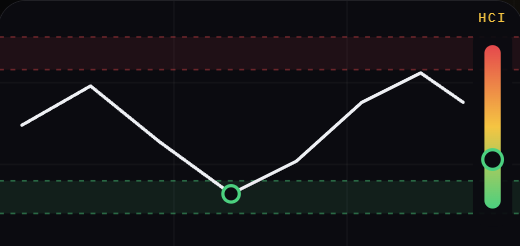
- Hill Conviction IndexOne number for too high or too low.
- HCI HeatmapHow price behaved at those levels before.
Bonus Features
- Divergence DetectorFlags when price and momentum disagree.
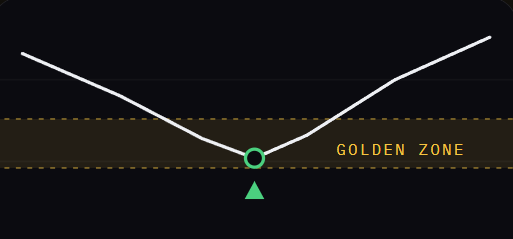
- Golden Zone DetectorMarks the high-probability pullback zone.
Toolkit Discord
- Toolkit TutorialsStep-by-step setup and how-to guides.
- 24/7 Question SupportAsk anytime and get a real answer.
Weekly Live Streams
- Live TA SessionsWatch the toolkit read real charts, live.
- Request Your TickersOwners pick the symbols I break down.
Main Features
Hill Zones
Buyer & seller zones, auto-drawn on any chart.
Hill Conviction Index
One number for too high or too low.
HCI Heatmap
How price behaved at those levels before.
Bonus Features
Divergence Detector
Flags when price and momentum disagree.
Golden Zone Detector
Marks the high-probability pullback zone.
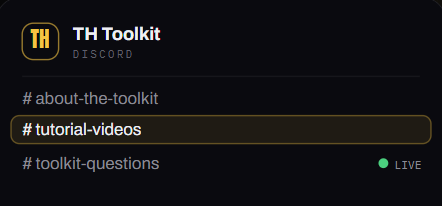
Toolkit Discord
Toolkit Tutorials
Step-by-step setup and how-to guides
24/7 Question Support
Ask anytime and get a real answer.

Weekly Live Streams
Live TA Sessions
Watch the toolkit read real charts, live.
Request Your Tickers
Owners pick the symbols I break down.
Learn More About
Each Tool.
The three core tools that work as one clear read. Tap any tool to see what it does.
The Hill Conviction Index tells you whether an asset is getting too high or too low — one simple number from +5 (too high) down to −5 (too low), so you can spot when a move is getting overextended in either direction.
A visual version of the HCI, painted right on the chart. As price moves it highlights the exact moments the HCI ran too high (red) or too low (green) — so you can see when it hit those extremes and how it behaved right after.
Automatically detects the key Buyer and Seller zones on any chart, on any timeframe. Green zones are where buyers tend to step in and price tries to bounce; red zones are where sellers tend to dump it — so you instantly see where price is most likely to react.
Two Brand New
Bonus Features.
Two new detectors added on top of the core toolkit — included at no extra cost, and live on your charts the moment you own the toolkit.
Divergence Detector
Automatically flags when price and momentum disagree — the early warning that a move may be running out of steam, often before the reversal shows up on the candles.
Golden Zone Detector
The Golden Zone Detector automatically plots the Golden Fibonacci zone on your chart at the click of a button — so you can see, within seconds, exactly where this very important zone sits. It's one of the most watched areas in trading: the high-probability spot where price tends to find support on a pullback.
- Play Video Here
Let's See It
In Action.
No theory and no cherry-picked hindsight. Here’s a real setup I took recently, read straight off the toolkit, walking through exactly how the tools lined up before I got in.
A real setup, start to finish
How the zones, conviction, and heatmap flagged it before the move — not after.
The exact read, step by step
Every signal I looked at and why, so you can see the thinking, not just the result.
The same read you'll make
Nothing here you can't do yourself once the toolkit is on your charts.
You're Not
On Your Own.
Your access includes the TH Toolkit channels inside our Discord, setup tutorials, a place to get your questions answered, and a live TA session every week. You’re not buying a file and figuring it out alone.
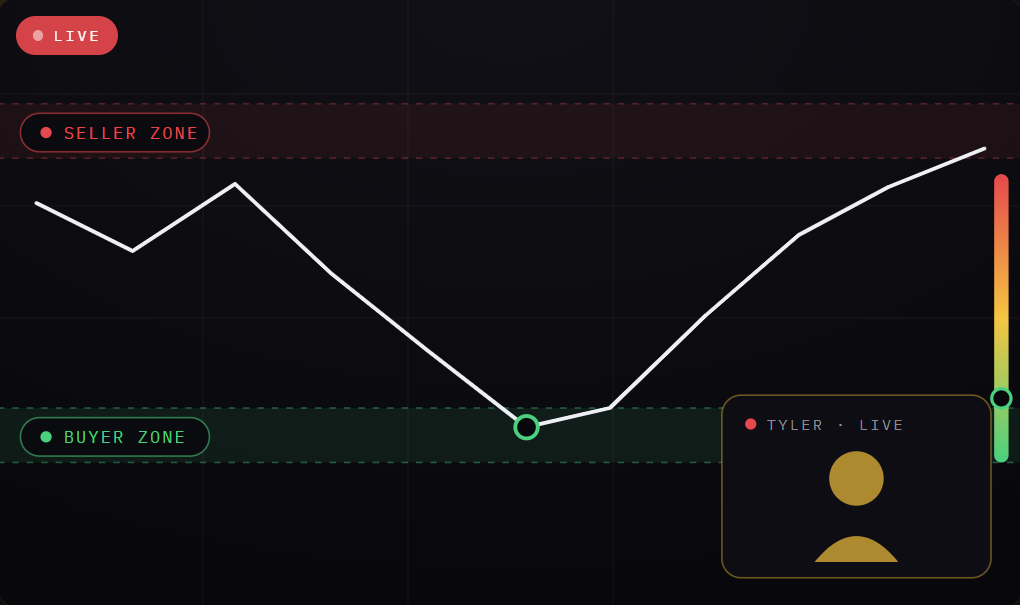
Live Streams For
The Toolkit Members.
Every week I go live and read real charts with the toolkit on them, and members can request their own tickers. It is included with the toolkit.
Toolkit Discord Access
Step-by-step walkthroughs for all three tools, including the full video guide — so you're set up and reading charts fast.
Ask anything in #toolkit-questions and get a real answer — you're never left figuring it out alone.
#about-the-toolkit breaks down what each tool does and how to get set up, so nothing is left unclear after buying.
One Plan.
Everything Included.
Lifetime · One-time payment
$199
once
Pay once, keep it for good, including both new detectors and every future update.
- Hill Zones
- Hill Conviction Index (HCI)
- HCI Heatmap
- Divergence Detector *NEW
- Golden Zone Detector *NEW
- Weekly Live Streams *NEW
- Real-time alerts
- 24/7 support
- All future updates
SECURE CHECKOUT VIA FLUX CHARTS · INSTANT TRADINGVIEW ACTIVATION
From Checkout To Charts.
1
Check out
Complete your purchase
One secure checkout. That’s the only payment, ever.
2
Check your email
Hit Get Started
A confirmation email lands in your inbox with a Get Started button and a full setup tutorial.
3
Connect & go
Link TradingView + Discord
Get Started routes you to connect both. Your dashboard has the same tutorial, plus tools, questions, and future updates.
Frequently Asked
Yes. TH Toolkit runs on TradingView's free plan, all you need is a free account. There's no separate software to install.
Enter your TradingView username at checkout. Once access is granted, open TradingView, go to your Indicators list under "Invite-only scripts," and add TH Toolkit to any chart.
Every purchase includes the TH Toolkit Discord, setup tutorials, a channel to get your questions answered, and a live TA session every week where I read real charts with the toolkit on them. Owners can even request the tickers they want broken down live.
Any market and timeframe available on TradingView, stocks, crypto, forex, futures, and indices all work out of the box.
Always. Your one-time payment includes every future update and improvement to the toolkit at no extra cost.
Stop Guessing.
Start Reading.
Trade better by thinking better with a toolkit built for structure, discipline, and smart decisions.

BY TYLER HILL · POWERED BY FLUX CHARTS
TH Toolkit is an educational technical-analysis tool and does not constitute financial advice, a recommendation, or a solicitation to buy or sell any security. Trading involves risk of loss. Past performance and historical readings do not guarantee future results. Always do your own research. © 2026 Tyler Hill. All rights reserved.