Where everyday investors learn to read the market.
I’m Tyler Hill, investor, entrepreneur, and educator. I help everyday people cut through the noise across stocks and crypto, build real skill with proven frameworks, and make smarter decisions with their money.

Make Money In Any Market
Long, short, and leveraged. The moves the pros make, explained simply.
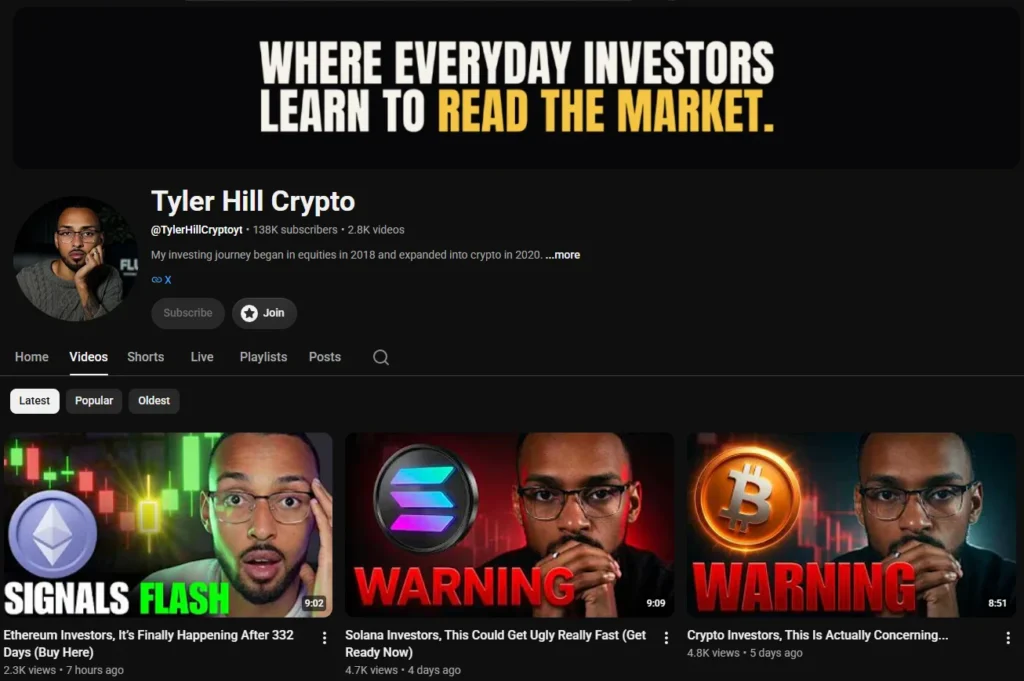
Tyler Hill Crypto
Trend analysis and breakdowns of the biggest moves in digital assets. Bull, bear, or sideways, I explain what’s happening and how to position for it.
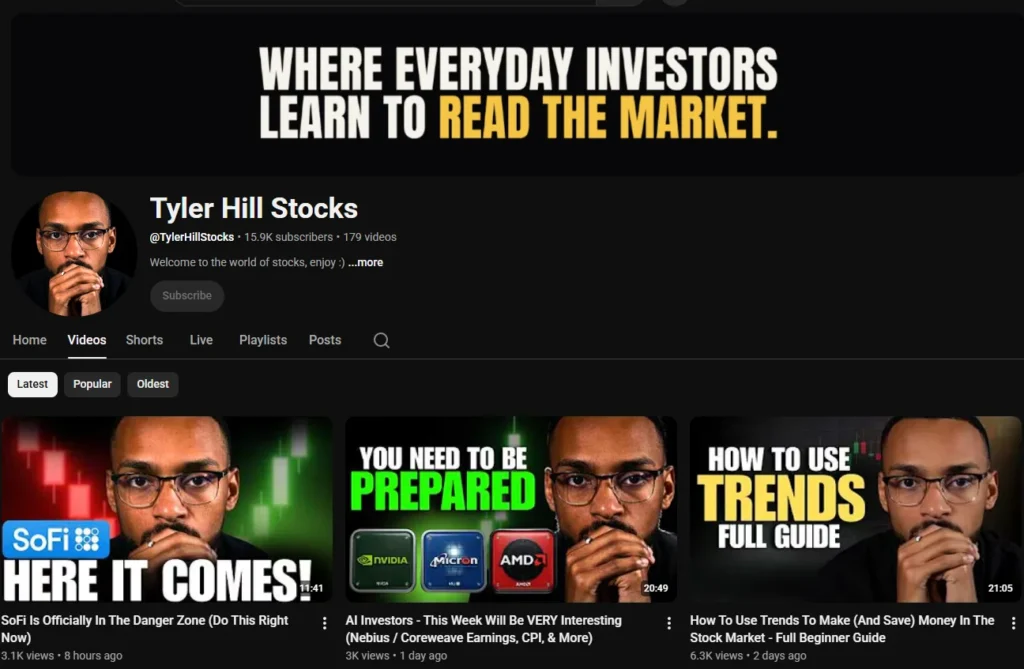
Tyler Hill Stocks
From individual equities to the macro signals that move everything, I share the bigger financial picture so you can see how the markets connect.
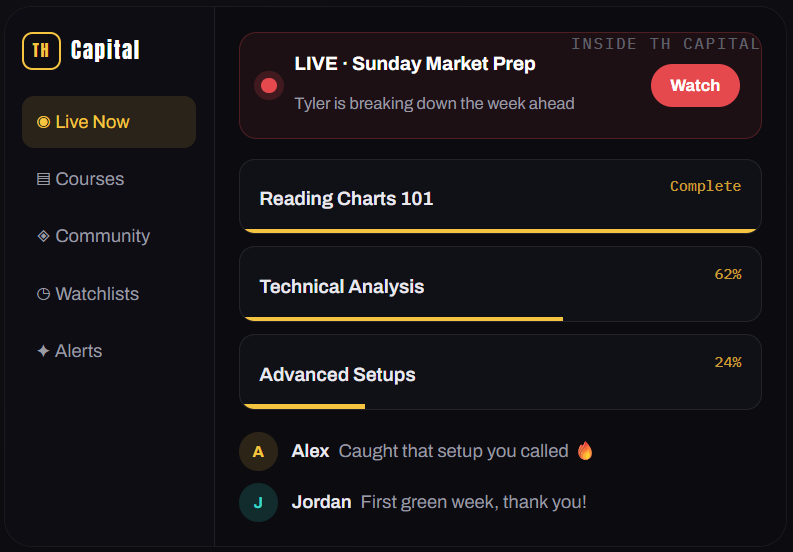
Learn the system, with the community
The home base for everyday investors learning to read the market, stocks and crypto, side by side.
- Full course library, chart reading and technical analysis, beginner to advanced.
- Live sessions & market breakdowns across both stocks and crypto
- An active community of investors learning and growing together.
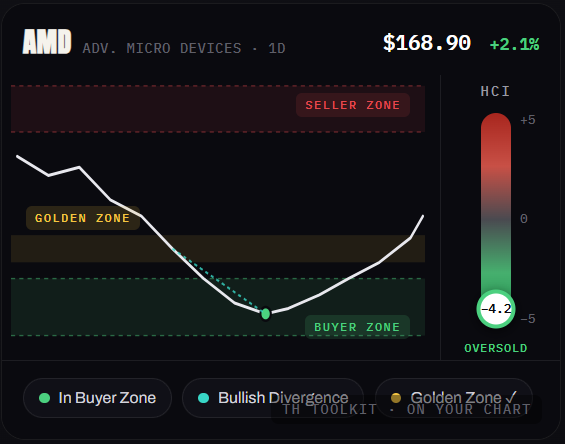
Read any chart with confidence
My complete on-chart trading toolkit, the same system I use, built right onto your charts so you can see the setup at a glance.
- Hill Conviction Index (HCI): one clear read of momentum and conditions.
- Hill Zones: the key levels that matter, drawn for you.
- Divergence & Golden Zone Detectors: spot the signals automatically.
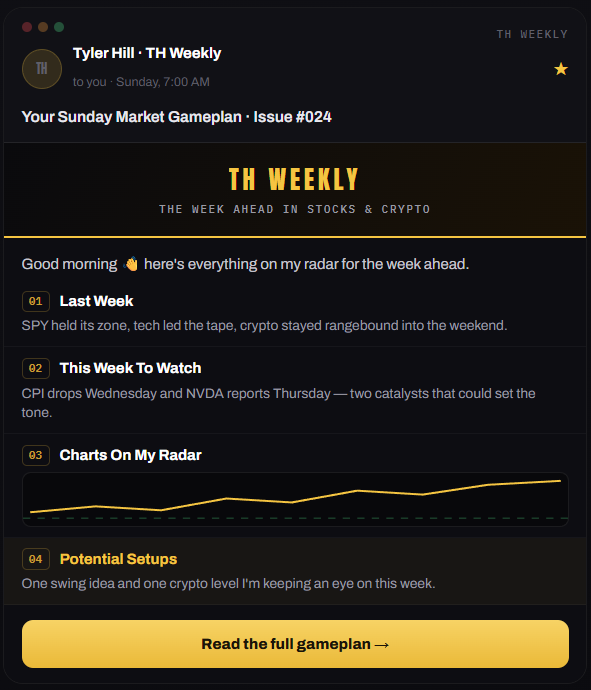
Your Sunday market gameplan
Every Sunday, the week ahead in stocks and crypto, what’s moving, the levels that matter, and where the opportunity is. Free, in your inbox before the open.
- A recap of last week for context, and the key events to watch this week.
- Charts on my radar and a couple of potential setups worth a look.
- A five-minute read whether you trade weekly or invest for the long run.
What the community says
- 4.9 (23 Reviews)
Mark
★★★★★
Since stumbling onto Tyler watching YouTube, I’ve come leaps and bounds in my knowledge base of investing. From the fundamentals, to more advanced strategies, to the psychology of the market… You will learn something! He’s genuinely passionate about making a difference in your financial future. I know this because he see’s his legacy as being judged by the quality and quantity of peoeple he’s able to help be successful in this incredibly challenging stock market. So, if you wanna take charge of your financial future… Join the Hill community and be, better, period!
Written August 11, 2026, 2 months after purchase
TuxxyTrades
★★★★☆
3 big reasons I vouch for TH Capital:
Tyler doesn’t miss a beat. Whether it’s a deep-dive course, a live stream, market-moving news, or a random question in Discord, his breakdowns are always fast, relevant, and sharp.
Real strategy over “get rich quick” noise. From long-term portfolio building to pinpoint swing trade setups, there’s something here for everyone—with a heavy dose of reality that keeps you grounded.
The Discord is actually elite. It’s a genuinely great global crew of traders sharing ideas, cracking jokes, and leveling up together without the usual toxicity. Finding all of that under one roof is rare. Highly recommend.
Written August 10, 2026, 2 months after purchase
Dimetry Perry
★★★★★
Best whop subscription I’ve ever bought hands down. This is the first community I’ve join where everything feels cohesive, from the mentors to the mentees it genuinely feels like a giant support group, which in a weird way helps quell the emotional swings we often face in this industry. Furthermore the knowledge I’ve gained since I’ve joined this community
Written August 10, 2026, 2 months after purchase
dcfan4ever
★★★★★
I’ve already learned a ton from Tyler. I’ve recommended it to friends in the real world and now im recommending it to strangers on the internet.
Written August 7, 2026, 20 days after purchase
Leonjt
★★★★★
I would really recommend TH capital. The training is in depth and comprehensive, much better than some other more expensive discord groups, the community is very active and friendly and Tyler is actively involved in the discord and always replies to questions and comments. There are also regular seminars and technical analysis sessions so really good for investors and really good value for the price!
Written August 7, 2026, 2 months after purchase
Yannick Ebner
★★★★★
I like to think there’s a learning curve when it comes to investing. Unfortunately, it’s difficult up to a point to learn anything new due to the lack of resources available to those trying to teach themselves. I came across Tyler Hill when he released his first yt video on his stock channel. From that moment I realisedhe was something different, something special and the moment he announced a subscription service to dive deeper into his wealth of knowledge I pounced on it. I haven’t been disappointed: that learning curve I mentioned feel like a rocket at this point, not only are the courses thorough and easy to understand, but the discord community you get access to is itself a trove of knowledge. The only investing community I am a part of and the only one I need. Thank you Tyler Hill.
Written August 7, 2026, 2 months after purchase
calvind5
★★★★★
Honest Review: I haven’t seen a course this in-depth for all levels of investors/ traders. It’s beginner friendly as well as for people doing more advance technical analysis. Tyler blew this course out of the park with the level of detail he provides and the on going revisions and feed back to the community. Speaking of community he has gathered built a discord with great like minded people. You will a thing or two from all the shared knowledge among the them. Love Tyler’s energy and enthusiasm. Definitely check out this course and his channel! Would recommend this course!
Written August 7, 2026, 2 months after purchase
Eli Carnes
★★★★★
Being in TH Cap has completely changed the way I view investing and has helped me gain so much knowledge about the market and stocks in just a couple of months. Tyler is amazing and makes everything incredibly easy to understand. He’s very consistent, and it’s 100% worth the money. I’m confident the knowledge I’ve gained in such a short time will make me far more money than any other program I’ve been a part of or learned from. TH Cap is great, Tyler is great, and joining has completely changed the course of my investing journey.
Written August 7, 2026, 1 month after purchase
Will
★★★★★
Since joining TH capital after watching Tyler for months, i am so happy I made the commitment to being part of his community, everything that is provided for you in terms of knowledge, exclusive messages, and overall environment to your investment journey is priceless. I’ve gone from being an investor who guesses to an investor who uses the TH toolkit to make better decisions. Tyler shows care to the community by interacting with us and everyone wants to see each other succeed. Thank you Tyler and the team!
Written August 7, 2026, 20 days after purchase
Martin Smith
★★★★★
T is the best genuine brother
Written July 30, 2026, 2 months after purchase
Trusted by great brands
The companies we work with to bring tools and opportunities to our community.
BTCC
Crypto Exchange
iTrustCapital
Crypto IRA
Liquid Trade
Trading Platform
moomoo
Investing App
Questions, partnerships, press
Whether you’re a brand looking to partner or just have a question, drop a note and the team will get back to you.
Prefer email? TylerHillSupport@gmail.com

© 2026 Tyler Hill. All rights reserved. Educational content only, not financial advice. All investing involves risk; do your own research and consider consulting a licensed professional.